What you can’t see with your grizzly! Advanced simulations to understand seasonal effects on operations
A challenge that’s not appreciated in regions with temperate climates is the adverse weather conditions that our clients experience operating in other regions. Canada is a prime example of how winter can cause significant headaches with temperatures dropping to –40°C degrees across the northern tundra to –15°C degrees in the south, lasting upwards of six months of the year!
During transport, material can freeze, creating frozen lumps in the order of six feet depending on the moisture levels in the material. This creates a significant problem for handling and transporting bulk materials from mine to port. These large lumps are much more difficult to shift through equipment causing blockages and increased wear and tear on mechanical systems, ultimately leading to downtime while attempts to unblock the transfer chute are made.
Our team was asked a few seemingly simple questions:
- How hard is it to break these lumps?
- How will it affect the equipment?
- How do we improve our operations?
For instance, would a lump of material break when being dropped from the height of a desk? What about the height of a roof?
You’d be surprised how strong these frozen blocks of ice and material can be!
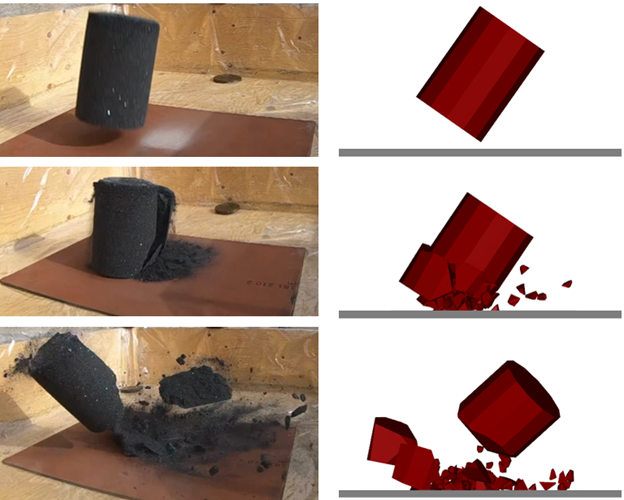
Our granular flow performance team took on the challenge of seeing how hard it was to break these lumps and what that meant for the client’s mechanical tippling equipment. Lumps of frozen concentrate weighing 7.5 kilogram (kg) were created in laboratory conditions, mimicking the typical dimensions of lumps the client had observed. These were then used for the purpose of breakage testing (by dropping them). It took a drop height of 3 meters to break the lumps and even then, only a fragment of the original cylinder chipped away! This equates to over 200 Joules of energy or over 50 kg of mass on impact.
Once the results were received, we created and calibrated our breakage model to replicate the behavior we observed using discrete element method (DEM) flow modeling. DEM is a tool that’s used to visualize material flow and can be used to simulate free flowing material, sticky material, and practically any shape you can think of. It’s also used to investigate all sorts of equipment interactions wherever you have material flowing (or not flowing when it should).

Conversion to ‘digital twin’: Left image of the broken lump in the laboratory compared to the broken lump in DEM.
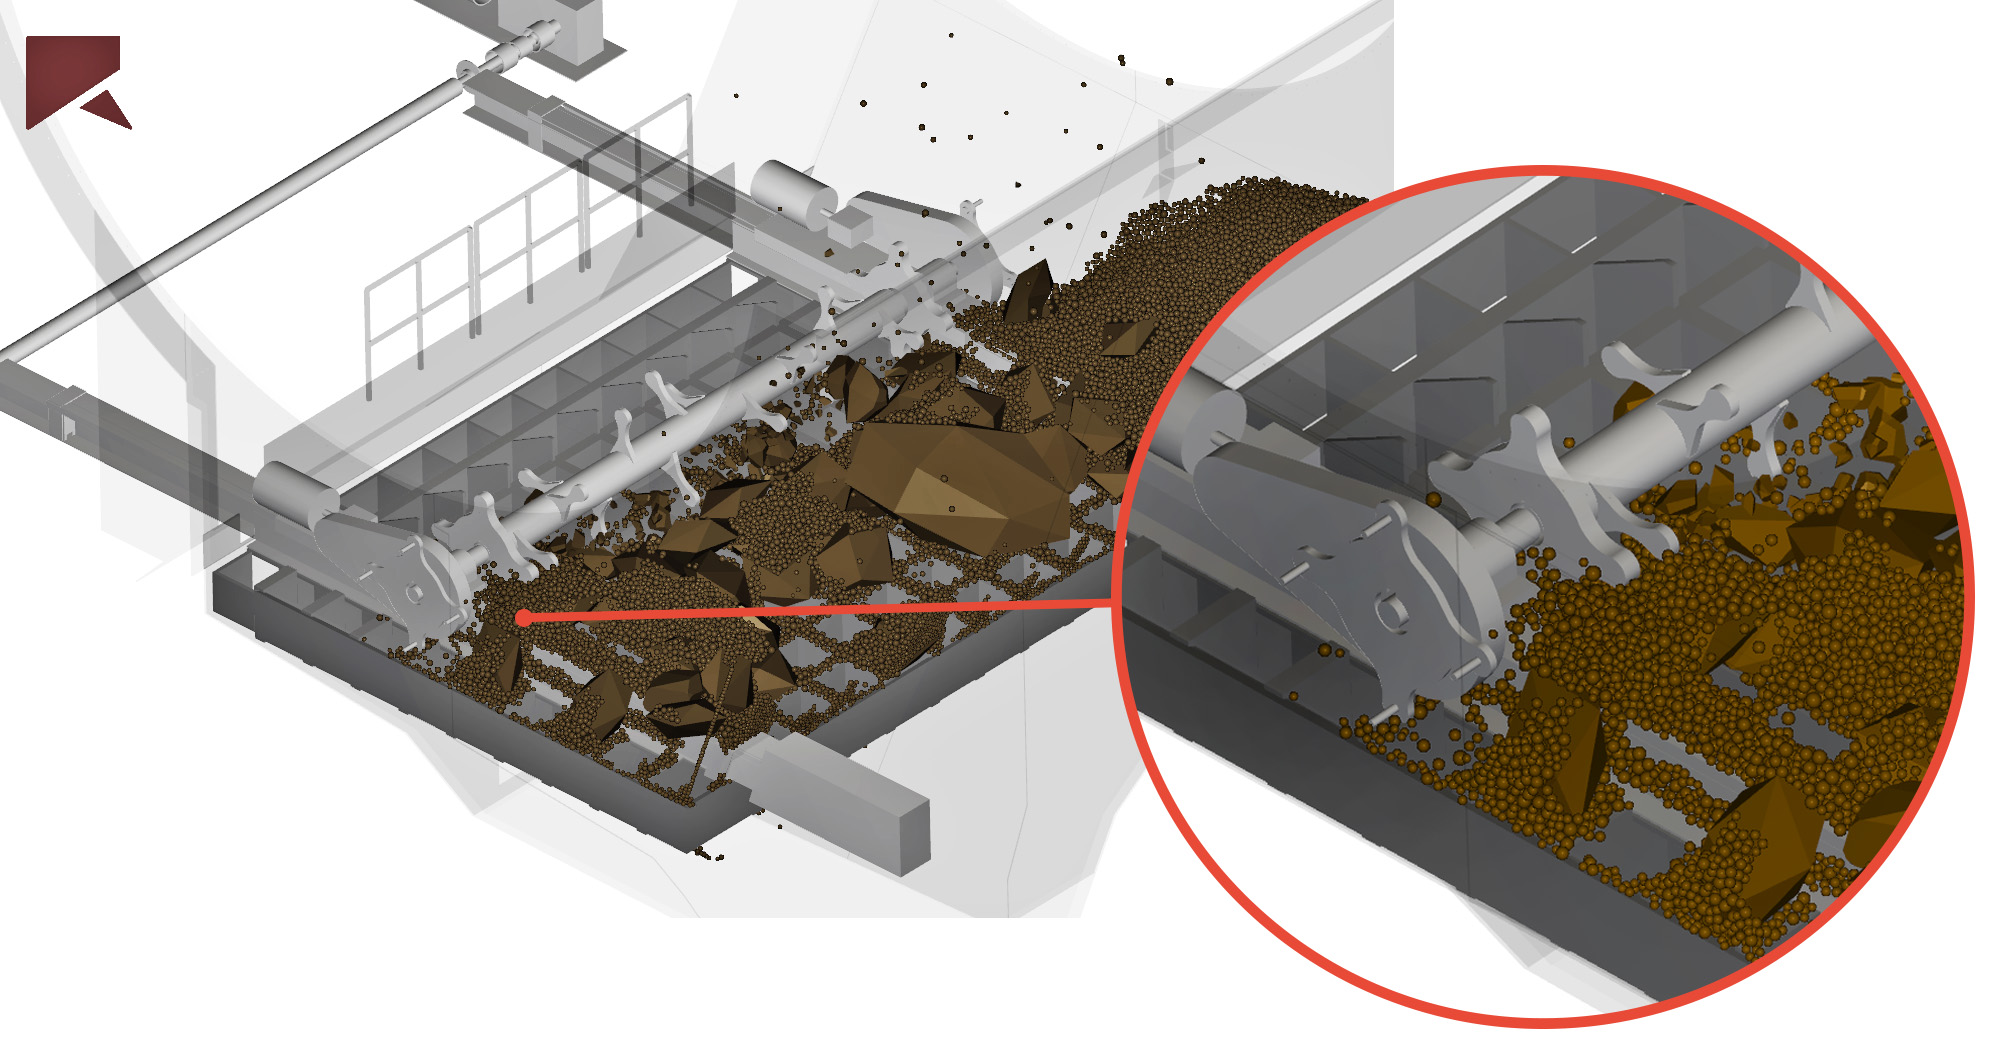
A grizzly is a type of screen which is placed in the tippler hopper to help break lumps on impact. It is intended to protect the equipment that is below it, i.e., a crusher or belt feeder.
The calibrated DEM and breakage model demonstrated that the drop height from the tippler to the grizzly wasn’t enough to break the lumps.
What we couldn’t see from the outside is that the fines create a cushioning effect, so there was practically zero breakage, which is perfect for iron ore pellets and potash, but not so great for frozen lumps.
The grizzly starts to fill with lumps after the first dump and by the tenth dump it’s completely blocked and material can’t get through to the feeder below.
Why is this such an issue?
Typically, the trains loading material into the tippler hopper are formed of over forty carriages, meaning the system is delayed a minimum of four events per train. To improve the operation of the tippler system, a lump breaker needs to translate across the grizzly to clear the way for the next train load and reduce the blockages.

